
Organic Visibility Overview
What this is
The Organic Visibility Overview helps you quickly gauge your site’s organic reach over time using four key metrics: Impressions, Clicks, Click‑through Rate (CTR), and Average Position. Use the Overview chart to spot trends and anomalies, switch projects to compare performance, and export data for stakeholders. Results are always scoped to your selected Project and Date Range, so confirm those filters before drawing conclusions.
Purpose
What this is
The Organic Visibility Overview is a high‑level summary of organic performance over time. It plots Impressions, Clicks, CTR, and Average Position so you can monitor visibility trends, benchmark performance, and quickly identify anomalies.
When to use it
- When to use it: fast health check, date‑range review, spotting sudden changes, stakeholder updates.
Step‑by‑step
- Open SEO Dashboard → Organic Visibility → Overview.
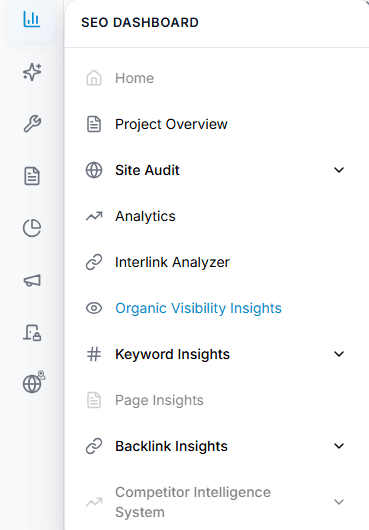
Capture: the Overview chart and the metric cards
Select correct Project
Select the correct Project (especially if you manage multiple websites).
Capture: the Overview chart and the metric cards
Select Date Range
Set the Date Range to match the period you want to analyze.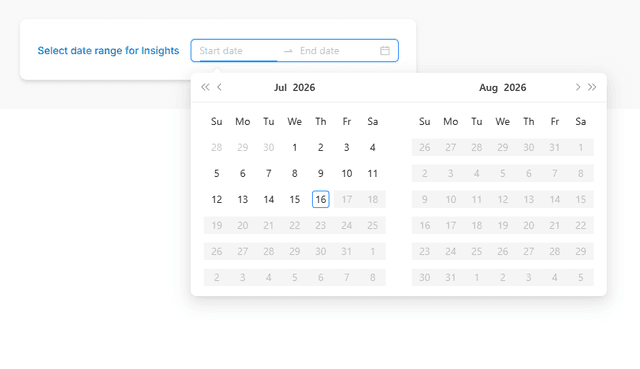
Capture: the Overview chart and the metric cards
Review Summary Cards
Review the Summary cards for totals across the selected range.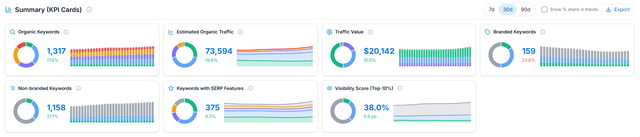
Capture: the Overview chart and the metric cards
Scan the Performance chart
Scan the Performance chart for trend direction and unusual changes.
Notes / Best practices
Notes / Best practices
- Treat this page as your starting point; use Quick links to drill into details when you see changes.
- Always confirm Project and Date Range before comparing results.
- Use shorter and longer date ranges to separate short‑term noise from sustained trends.
- A change in Impressions without a similar change in Clicks often indicates a shift in ranking/coverage or search demand.