
Purpose
What this is
Device/Location Breakdown helps you analyze organic visibility across different devices and geographic locations. Compare performance between Desktop, Mobile, and Tablet, or evaluate visibility by country or region to identify SEO opportunities.
When to use it
- Compare organic performance across Desktop, Mobile, and Tablet.
- Identify countries or regions with improving or declining visibility.
- Find segments where CTR or rankings need improvement.
- Plan device-specific or location-specific SEO optimizations.
- Export segment reports for stakeholder reporting.
Where to find it
- Open SEO Dashboard.
- Select Organic Visibility.
- Choose Device/Location Breakdown.
- Confirm your Project and Date Range before analysis.
Step-by-step
Open Device/Location Breakdown
Navigate to SEO Dashboard → Organic Visibility → Device/Location Breakdown.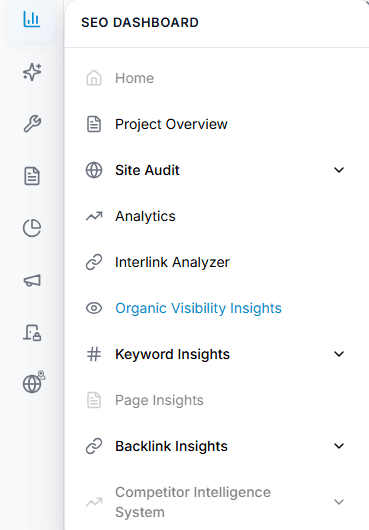
Capture: the Overview chart and the metric cards
Select Project
Choose the website project you want to analyze.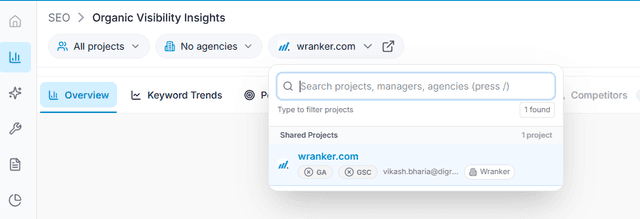
Capture: the Overview chart and the metric cards
Choose Date Range
Select the reporting period for your analysis.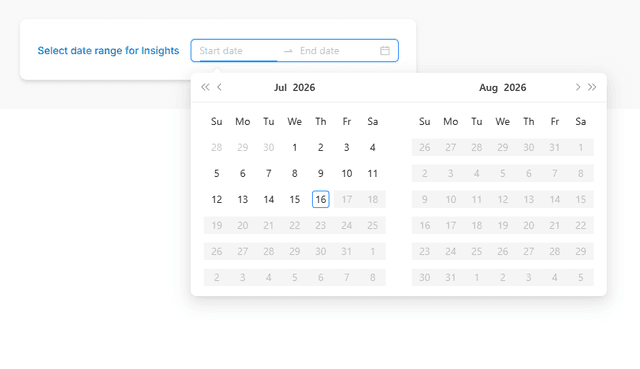
Capture: the Overview chart and the metric cards
Select Device
Switch between Desktop, Mobile, and Tablet views.
Capture: the Overview chart and the metric cards
Filter by Location
Choose a country or region to review segment performance.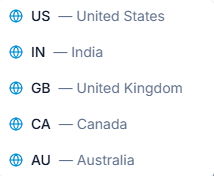
Capture: the Overview chart and the metric cards
Analyze Results
Review charts and tables using Clicks, Impressions, CTR, and Average Position.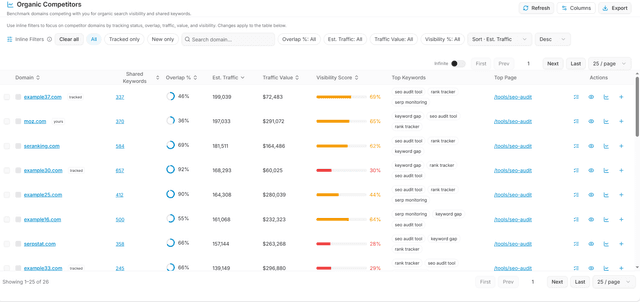
Capture: the Overview chart and the metric cards
Key Features
Device Selector
Compare Desktop, Mobile, and Tablet performance.
Country/Region Filter
Analyze organic visibility by market or region.
Trend Charts
Track visibility changes over time.
Breakdown Table
Review Clicks, Impressions, CTR, and Average Position.
Compare Segments
Compare device or location performance.
Export
Download reports for sharing and analysis.
Tip
Start with high-impression segments that have a low CTR. These often represent the quickest SEO optimization opportunities.
What You'll See
Device Selector
Switch between Desktop, Mobile, and Tablet.
Country Selector
Filter performance by country or region.
Trend Charts
View visibility trends over the selected period.
Breakdown Table
Analyze Clicks, Impressions, CTR, and Average Position.
Compare Controls
Compare performance across devices or locations.
Export
Download filtered reports for analysis.
Suggested User Flows
Compare Device Performance
Review Mobile performance, compare it with Desktop using the same date range, and identify device-specific optimization opportunities.Analyze Country Performance
Select a country or region, review performance trends, and identify localization opportunities.Export Reports
Apply Device and Location filters, export the data, and share the report with stakeholders.
Tips & Best Practices
- Keep the same date range when comparing different devices or locations.
- Focus on high-impression segments with low CTR first.
- Review mobile performance separately to identify mobile-first SEO issues.
- Export monthly reports to monitor long-term performance trends.