
Who this is for
This guide is for anyone responsible for monitoring and improving the technical health of a website—SEO managers, website owners, developers, and agency teams.
Prerequisites
- You must have a Wranker project created for your website.
- Appropriate permissions to view Site Audit data.
Google Search Console (GSC) is required specifically for the Coverage section in Site Audit. Other Site Audit sections can still be reviewed even if GSC isn’t connected.
Where to find it
- In the left sidebar, select SEO from the vertical navigation menu.
- In the secondary menu, click Site Audit.
- Select Site Audit – Overview.
The breadcrumb near the top of the page should read SEO > Site Audit – Overview.
What you’ll see
Tab Index Overview
A grid of cards summarizing each audit section. Each card includes a short description, status icon, and a Go to Tab link.
Top actions and filters
- Top-right actions include Create Project and Export.
- Filters allow selection of All Projects or a specific project.
- You can also filter by All agencies where applicable.
Steps
Open Site Audit – Overview
Open Site Audit – Overview using the navigation path above.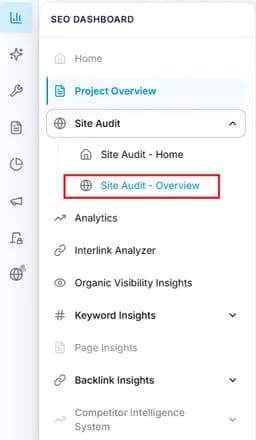
Capture: Analytics panel showing the Analytics overview graph and the date-range selector.
Select project
Use the project selector dropdown to choose a specific project if you manage multiple websites.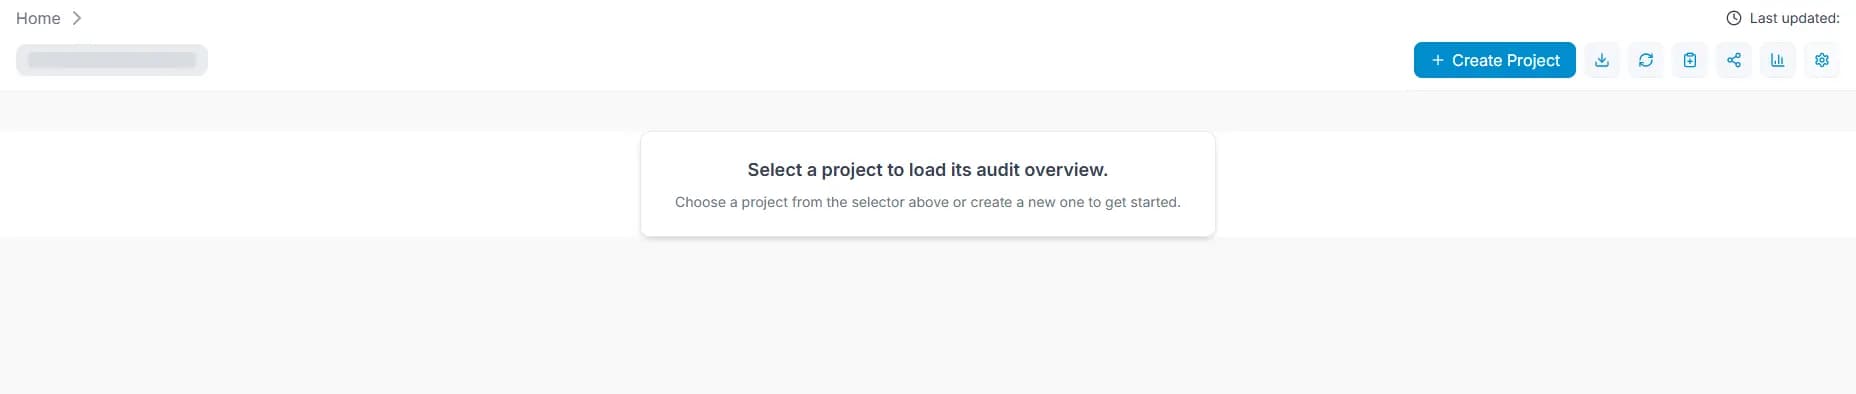
Capture: Analytics panel showing the Analytics overview graph and the date-range selector.
Review Tab Index Overview
Review overview cards. Green indicates completion, yellow indicates issues found, and red indicates critical issues.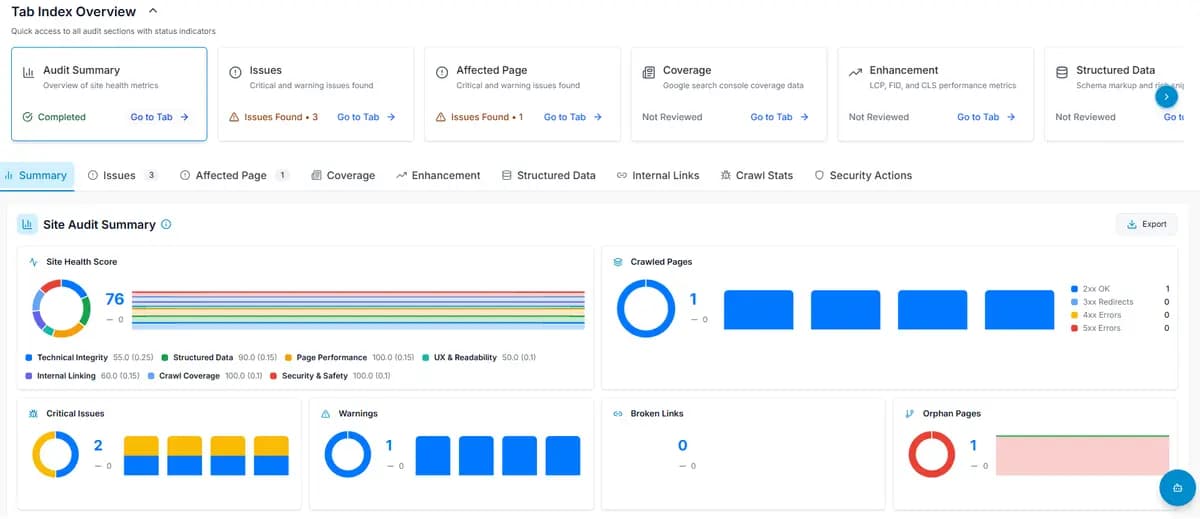
Capture: Analytics panel showing the Analytics overview graph and the date-range selector.
Open detailed reports
Click Go to Tab on any card to view detailed reports for that section.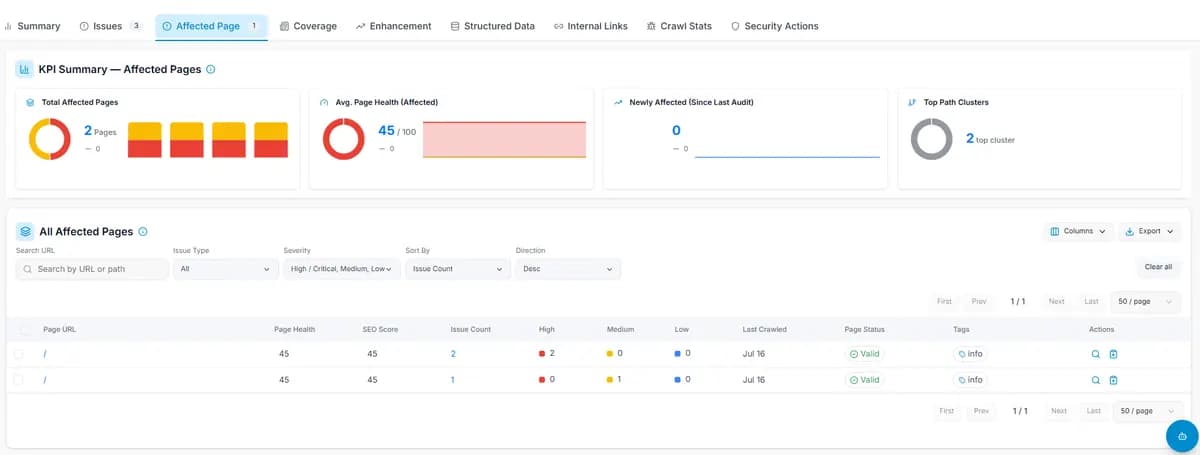
Capture: Detail reports.
Export overview report
Use Export to download the overview report in CSV/PDF format if available.
Capture: Export overview report.
Expected result
After following these steps, you’ll have a clear snapshot of your site’s technical health and can quickly navigate to any section requiring action.
Tips & Best Practices
- Monitor Issues and Affected Page cards regularly to track improvements.
- Fix critical issues before addressing warnings.
- Use Create Project if you need to audit a new website.